

Hi Bi community. Before Start with the publications I would like to explain the goal with “Get M!” posts.
For this category, I’ll focus exclusive in M language, no beautiful and crazy layout. For me this is the most important part of an BI project, so with time, this will be the largest category of the site. Is a project for a big company, with Gigabytes of data, you will be better using a well structured Data Warehouse (DW), probably using SSDT (SQL Server Data Tools), but the goal here is to show the capability of the Power Query.
API Limits
In this example, we are trying to determinate an relationship between the many hardware components price (in the Brazilian market) and the purchasing power of the Real (that we get by comparing with the US dollar). For this we will need the historical record, preferably from an trusted source. Our final goal is to display in an single graph the percentage change (product value in the period divided by the average of the historical value product), of all product and the dollar.
Métodos de modelagem que veremos:
- Consume a public API (Query Dolar, step 7.2);
- Repeat a query and append the result in a single table (Query Dolar steps 2 to 7.4);
- Get data from a site that does not contain tables (Query Function to query the historical price, all steps);
- Convert a Query in a custom function (Query Function to query the historical price, step 4)
List of data acquisition, let’s go shop?
- Historical Dollar Real exchange rate;
- Scraping Historical of the hardware products price in the Brazilian market:
- Custom Function to consult prices;
- Table to invoke the created custom function in many products.
- Final Result.
Exchange rate
So, let’s start with the simplyet. To Our lucky, the Banco Central do Brasil has an open API to Query those data. You can chek the whole documentation here.
For our purpose, we will need the historical base since 2018 until today. The API documentation says that it can only return an max of 6 months. But for some reason in my tests I could only get 5 at time, and for roundup the year querys lets make a call every 4 months.
So, our steps are:
1. Add a Blank Query to the Excel or Power BI;
2. Add the follow formula:
=List.Numbers(0, Number.RoundUp(((Date.Year(DateTime.LocalNow()) – 2018) * 12 + Date.Month(DateTime.LocalNow())) /4),4)
How it Works
This formula has the purpose to return a list of how many months there is between 2018-01-01 and today.
To understand the command lets debug:
A. The first function is the DateTime.LocalNow(), that will return today’s date, in this case 2020-03-05 08:22:02 PM.
B. Next, we will make a conversion using the functions Date.Year and Date.Month to get the Year and the month.
C. Now, lets calculate the month difference between both years.
D. And multiply by 12, converting years into months.
E. Sum the amount of months with the proportional months by year.
F. Divide by 4, since we will meka one call every 4 months.
G. Round up, otherwise the last month will not show up.
H. And at last, create a list containing 7 numbers, starting from 0 and adding every 4.
A.=List.Numbers(0,Number.RoundUp(((Date.Year(#datetime(2020,3,5,20,22,2))-2018)12+Date.Month( #datetime(2020,3,5,20,22,2) ))/4),4)
B. =List.Numbers(0,Number.RoundUp((2020-2018)12+3)/4),4)
C. =List.Numbers(0,Number.RoundUp(2*12+3)/4),4)
D. =List.Numbers(0,Number.RoundUp(24+3)/4),4)
E. =List.Numbers(0,Number.RoundUp(27/4),4)
F. =List.Numbers(0,Number.RoundUp(6,75),4)
G. =List.Numbers(0,7,4)
H. = {0,4,8,12,16,20,24}
3. Convert the list into a table
How
In the Ribbon “Transform”, at the Group “Convert”, click on “To Table”.
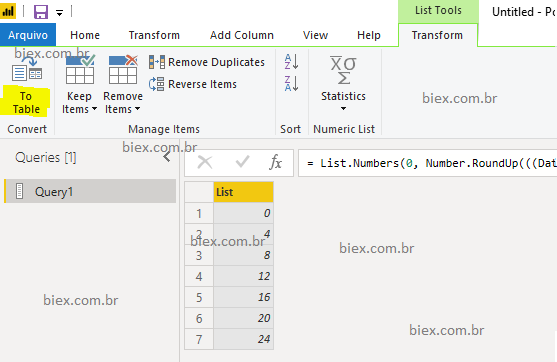
The formula should become similar to this: = Table.FromList(Source, Splitter.SplitByNothing(), null, null, ExtraValues.Error)
Where “Tabel.FromList” converts the previus step into (Source) from a list into a table.
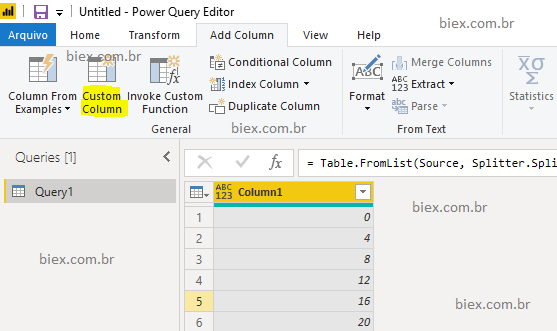
4. Now lets add an new column call “Início” with the formula Date.AddMonths(#date(2018,1,1),[Column1]).
How
In the Ribbon “Add Column” click on “Custom Column”.
And fill the fields as bellow:
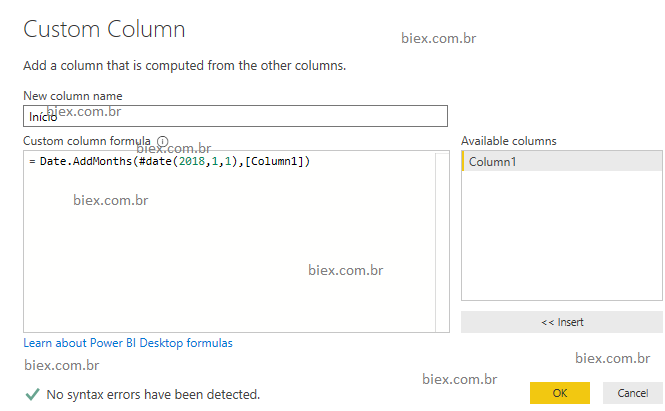
The final formula will be something like = Table.AddColumn(#”Converted to Table”, “Início”, each Date.AddMonths(#date(2018,1,1),[Column1])), where “Table.AddColumn” adds a new column to our table, with the value calculated base on the formula that we inform manually.
This works by adding months into the inform date in the parameter, lets see e examples:
1st row: Add 0 month to the date 2018-01-01 = 2018-01-01
2nd row: Add 4 months to the date 2018-01-01 = 2018-05-01.
5. Lets add one more column and call “Fim”, this time with the formula: List.Min({DateTime.Date(DateTime.LocalNow()), Date.AddDays(Date.AddMonths([Inicio], 4),-1)}).
How
The process to add a new column is the same as the previous step. The formula above defines the final
A. Get Today’s date DateTime.LocalNow()
B. Convert date time to date ( the format must be always the same to compare), DateTime.Date.
C. Get Value from the Column Início, [Início]
D. Add 4 months into Início Column, Date.AddMonths.
E. Remove one day from the calculated date on the previous Step, so we can have the last day from the previous month in compassion to the next row.
F. Check which date is the smmalest, List.Min. This step is important to avoid querying non existent date into the API.
A. List.Min({DateTime.Date( #datetime(2020,3,5,20,22,2) ), Date.AddDays(Date.AddMonths([Inicio], 4),-1)})
B. List.Min({#date(2020,3,5), Date.AddDays(Date.AddMonths([Inicio], 4),-1)})
C. List.Min({#date(2020,3,5), Date.AddDays(Date.AddMonths(#date(2020,1,1), 4),-1)})
D. List.Min({#date(2020,3,5), Date.AddDays(#date(2020,5,1),-1)})
E. List.Min({#date(2020,3,5), #date(2020,4,30)})
F. #date(2020,3,5)
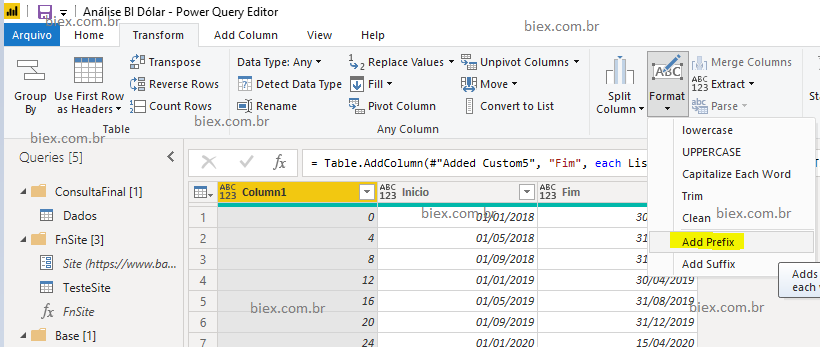
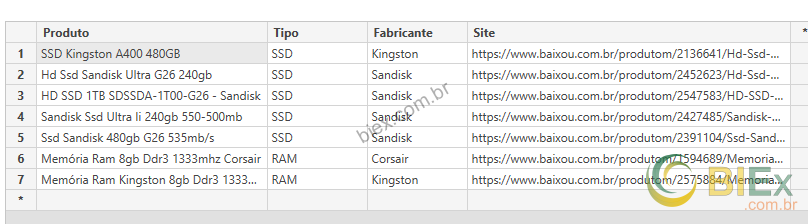
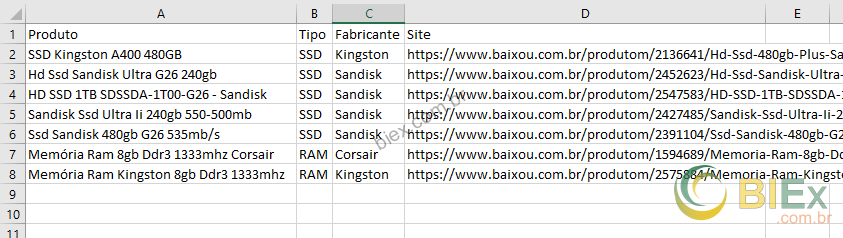
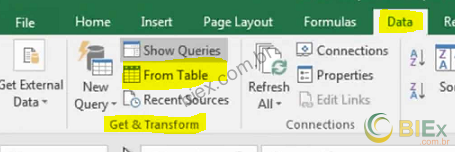
6. Before query the Banco Central do Brasil, we will convert our date to the api’s format “MM-dd-yyyy”. This can be done by editing the formula of add prifix, replacing the formula by Date.ToText(_, “MM-dd-yyyy”). B. Fill the asked parameter with any text , example “a”, and press “OK”. 7. Time to quey the API. We will add one more custom column with the formula of consume Web API, and we will modify the parameters in the date filed. The easiest way to do this is to add a New Query from the web. 7.1. Get a link from the site of Banco Central do Brasil. This can be done clicking here. in my case the result was the URL: https://olinda.bcb.gov.br/olinda/servico/PTAX/versao/v1/odata/CotacaoDolarPeriodo(dataInicial=@dataInicial,dataFinalCotacao=@dataFinalCotacao)?@dataInicial=’01-01-2020’&@dataFinalCotacao=’02-29-2020’&$top=100&$format=json 7.2. Add a New Query to call the API. B. Paste the URL from the previous sted and press “OK”. The Power Query will do the rest. 7.3. Copy the formula from the added query, and in the first Query, add a new Custom column named “Dolar”, changing the date fields in the URL to mach the columns “Inicio” and “Fim”. Before: Json.Document(Web.Contents( “https://olinda.bcb.gov.br/olinda/servico/PTAX/versao/v1/odata/CotacaoDolarPeriodo(dataInicial=@dataInicial,dataFinalCotacao=@dataFinalCotacao)? @dataInicial=’01-01-2020′& @dataFinalCotacao=’02-29-2020′&$top=100&$format=json”)) 7.4. Delete the added query on step 7.2. since it won’t be used any more. 8. At the first Query lets remove all other columns that does not call “Dolar”. 9. Expand the Column Dolar, selecting only the column “value”. 10. Add a custom formula, to convert a register list into a table, with the formula Table.FromRecords(_). The full formula must be something like Table.TransformColumns(#”Expanded Dolar”, {{“value”, each Table.FromRecords(_), type table}}). B. This the added formula makes reference to the previous step, in my case the step name is #”Expanded Dolar”. Your previous step name may different of the my. Before this reference we will paste the expression Table.TransformColumns( , and after we will paste the expression {{“value”, each Table.FromRecords(_), type table}}) 11. Expand the column “value” with the fields “cotacaoCompra” and “dataHoraCotacao”, that we will use. If you prefer the field cotacaoVenda can be use instead of cotacaoCompra. Lets also remane the column names to “Valor” and “Data”. 12. Apply detected data types. 13. Add a new data type step to convert the column “Data” from datetime to date. Select “Insert”. 14. Remove Duplicates, using Table.Distinct. This step is important to avoid error with our data set, since we do not know how the Banco Central do Brasil, stores his data. Is better add this step to be more cautions. 15. Add a new column call “Produto” with a fix text “Dólar”. Lets also indicate the data type in of the column by editing the M formula. Unfortunately we don’t have a trusted web site to search for the historical prices. So, for we at least have something to compare, I find a site that tracks the price of some hardware products, and we can get the date from it using the Scraping method since the site doe not have an public API. The site is baixou.com.br, so lets get started. Basically to Scraping the site we will have to search the data embedded in the HTML’s code, and keep our M code as generic as we can, since we want to use this query as a function and replicate in others pages. 1. We will query the follow site as “Web”: https://www.baixou.com.br/produtom/1594689/Memoria-Ram-8gb-Ddr3-1333mhz-Corsair. And rename the query to TesteSite. B. Paste the URL above in the parameter and press OK. 2. Delete the step “Navigation” automatic inserted by Power query. 3. Alter the formula “Web.Page” to “Text.FromBinary”. 4. Now we need to add a parameter call Site, we will use in the first step of the query ” TesteSite” and create a function base on this query. B. Fill the fields as it shows: C. Go back into the Query TesteSite and in the first step change the formula by replacing the URL between quotes by the parameter Site without quotes. It will be like this: D. Create an function base on the query TesteSite and naming it FnSite. E. The Querys will become like this: 5. Next we nedd to add this custom formula: = Text.Split(Text.Replace(Text.Split(Text.Split(Fonte, ” var prodId = “){1}, “”){0}, “‘”, “”),”;”) A. The first part of the formula Text.Split(Previous Step, ” var prodId = “){1} will break the HTML code, using the string ” var prodId = ” as a base, and of this result we will get the 2nd part {1}. 6. We will convert the list into a table, similar as the Step 3 of the query dolar. This query will invoke the custom fuction created in the previous query. This query will be named “Dados”. 1. Create a table containing the descripction of the product, the type of the product, the manufacturer and the URL of the site baixou.com.br. And fill as folows: Next select all the data and click on Data > Get & Transform > From Table (this path may vary depending of your Excel’s version). And fill as shown: Select the Dolar Query and Click “OK”. This project’s goal has been achieved, the table “Dados”. We can now load the queries and create this custom DAX measure to evaluate the data: With this we can plot the data in a line graph where the axis is the Data Column, Produto is the legend and Média Histórica is the value. Now we can analyse the data and check if the price of the hardware is related with the Real’s purchasing power. In the graph above we see the exchange rate of Real and the others products also shown. As far as I can tell, the result is inconclusive. Unfortunately the site that we choose has not enough data points. We need a data base with more products and with a bigger frequency. Any way, I hope that you could get some different technique to use in your projects with this article. Obrigado!
How
There are other ways to make this process, including a faster one. But I choose to make this way not because is simpler, but the way that may be new for the reader.
So to do this:
A. Edit a column by adding a prefix in Transform > Text Column > Format > Add Prefix.
C. Edit the syntax of the return M formula.
From: = Table.TransformColumns(#”Added Custom1″, {{“Inicio”, each “a” & Text.From(_, “pt-BR”), type text}})
To: = Table.TransformColumns(#”Added Custom1″, {{“Inicio”, each Date.ToText(_, “MM-dd-yyyy”), type text}}).
The original syntax concatenated for each row, the character “a”, with the date converted as Text. The new syntax, convert every row to the format “MM-dd-yyyy”.
D. To finish, we copy the same customization done in the column “Inicio” to the column “Fim”. Like this:
From: = Table.TransformColumns(#”Added Custom1″, {{“Inicio”, each Date.ToText(_, “MM-dd-yyyy”), type text}}) .
To: = Table.TransformColumns(#”Added Custom1″, {{“Inicio”, each Date.ToText(, “MM-dd-yyyy”), type text},{“Fim”, each Date.ToText(, “MM-dd-yyyy”), type text}}).
How
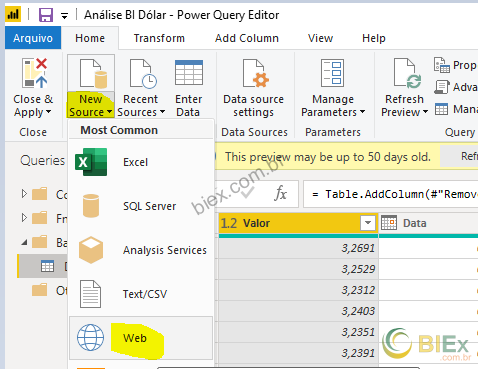
A. In Home > New Query > New Source > Web (the positian may change from program version).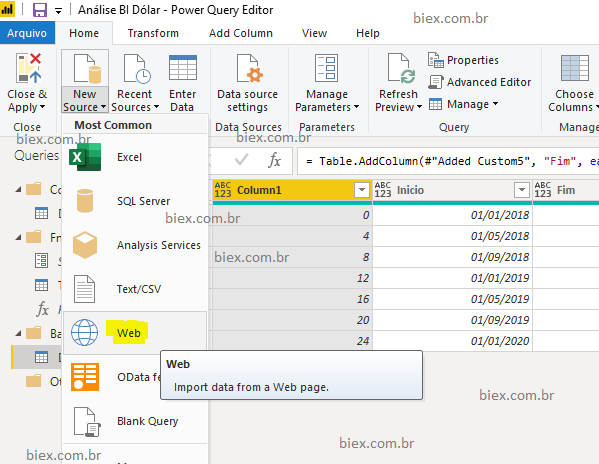
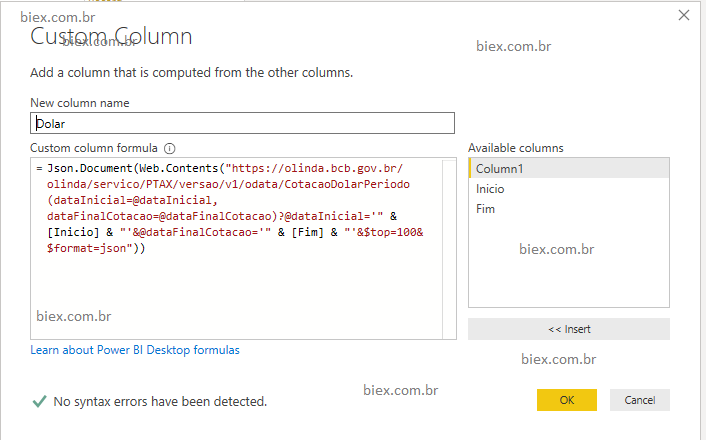
After: Json.Document(Web.Contents( “https://olinda.bcb.gov.br/olinda/servico/PTAX/versao/v1/odata/CotacaoDolarPeriodo(dataInicial=@dataInicial,dataFinalCotacao=@dataFinalCotacao)? @dataInicial=‘” & [Inicio] & “‘& @dataFinalCotacao=‘” & [Fim] & “‘&$top=100&$format=json”))
How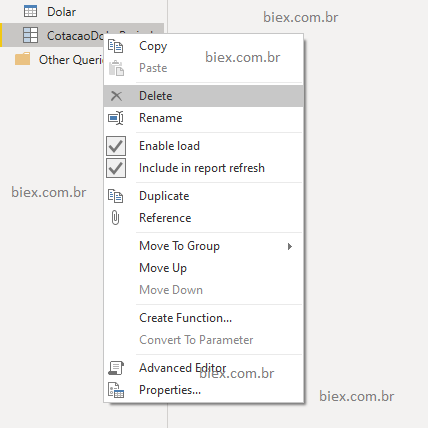
How
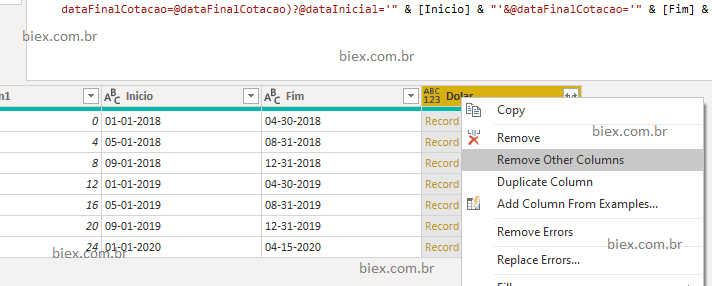
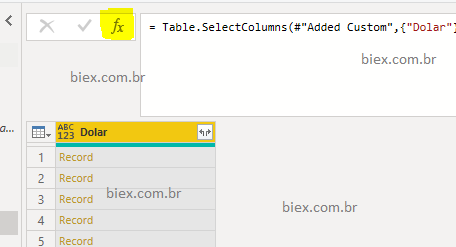
In the preview section, right click into the column “Dolar” and select “Remove other Columns”.
How
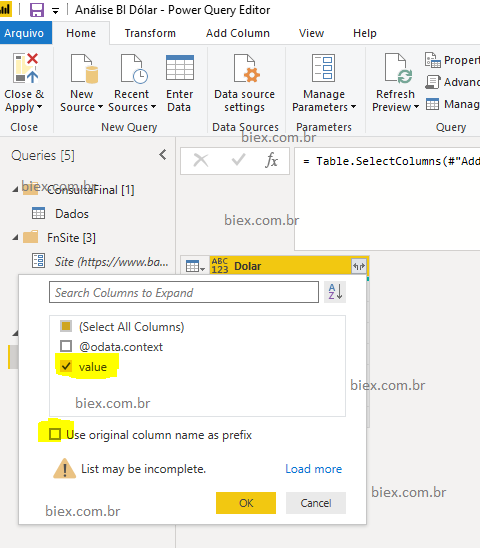
Again in the preview, click in the bow at the right corner of the Dolar Column, and Select value, unchecking the Use prefix option.
How
A. Add a custom Formula
C. The result will be:
How
A. Expand the same way as the Step 9.
B. Change the 2nd list of names in the the M formula.

How
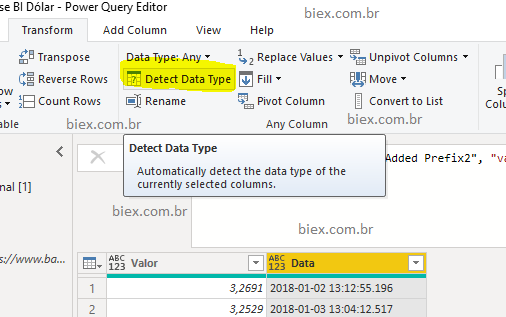
In Transform > Detect Data Types
How
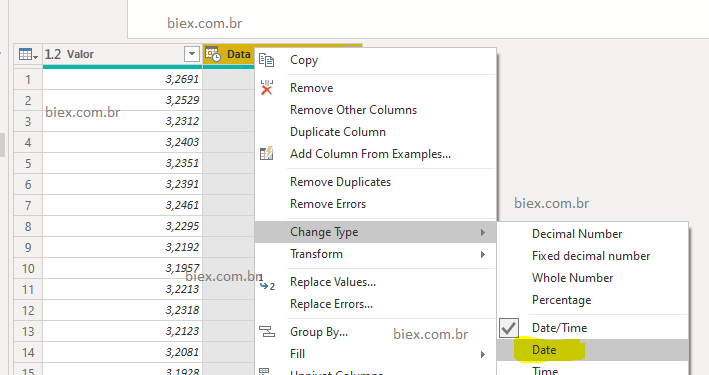
Right click on Column “Data” and select Change Type
How
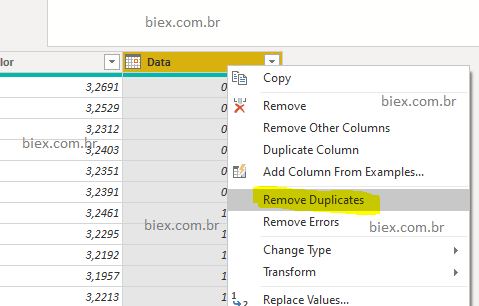
Right click column Data and Select “Remove Duplicates”.
How
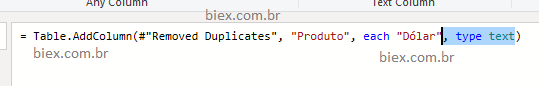
In Add New Column > Custom Column. The name of the Column Will be “Product” and his value will be “Dólar”.
Now edit the formula like this:
The result will be something like this:let
Custom1 = List.Numbers(0,Number.RoundUp(((Date.Year(DateTime.LocalNow())-2018)*12+Date.Month(DateTime.LocalNow()))/4),4),
#"Converted to Table" = Table.FromList(Custom1, Splitter.SplitByNothing(), null, null, ExtraValues.Error),
#"Added Custom5" = Table.AddColumn(#"Converted to Table", "Inicio", each Date.AddMonths(#date(2018,1,1),[Column1])),
#"Added Custom1" = Table.AddColumn(#"Added Custom5", "Fim", each List.Min({DateTime.Date(DateTime.LocalNow()), Date.AddDays(Date.AddMonths([Inicio], 4),-1)})),
#"Added Prefix" = Table.TransformColumns(#"Added Custom1", {{"Inicio", each Date.ToText(_, "MM-dd-yyyy"), type text},{"Fim", each Date.ToText(_, "MM-dd-yyyy"), type text}}),
#"Added Custom" = Table.AddColumn(#"Added Prefix", "Dolar", each Json.Document(Web.Contents("https://olinda.bcb.gov.br/olinda/servico/PTAX/versao/v1/odata/CotacaoDolarPeriodo(dataInicial=@dataInicial,dataFinalCotacao=@dataFinalCotacao)?@dataInicial='" & [Inicio] & "'&@dataFinalCotacao='" & [Fim] & "'&$top=100&$format=json"))),
#"Removed Other Columns" = Table.SelectColumns(#"Added Custom",{"Dolar"}),
#"Expanded Dolar" = Table.ExpandRecordColumn(#"Removed Other Columns", "Dolar", {"value"}, {"value"}),
#"Added Prefix2" = Table.TransformColumns(#"Expanded Dolar", {{"value", each Table.FromRecords(_), type table}}),
#"Expanded value" = Table.ExpandTableColumn(#"Added Prefix2", "value", {"cotacaoCompra", "dataHoraCotacao"}, {"Valor", "Data"}),
#"Changed Type2" = Table.TransformColumnTypes(#"Expanded value",{{"Valor", type number}, {"Data", type datetime}}),
#"Tipo Alterado" = Table.TransformColumnTypes(#"Changed Type2",{{"Data", type date}}),
#"Removed Duplicates" = Table.Distinct(#"Tipo Alterado", {"Data"}),
#"Added Custom2" = Table.AddColumn(#"Removed Duplicates", "Produto", each "Dólar", type text)
in
#"Added Custom2"Historical Prices
Hardware historical prices (scraping)
Function to query prices
How
A. Add a new Query to the type “Web”.
C. Select Document and press OK.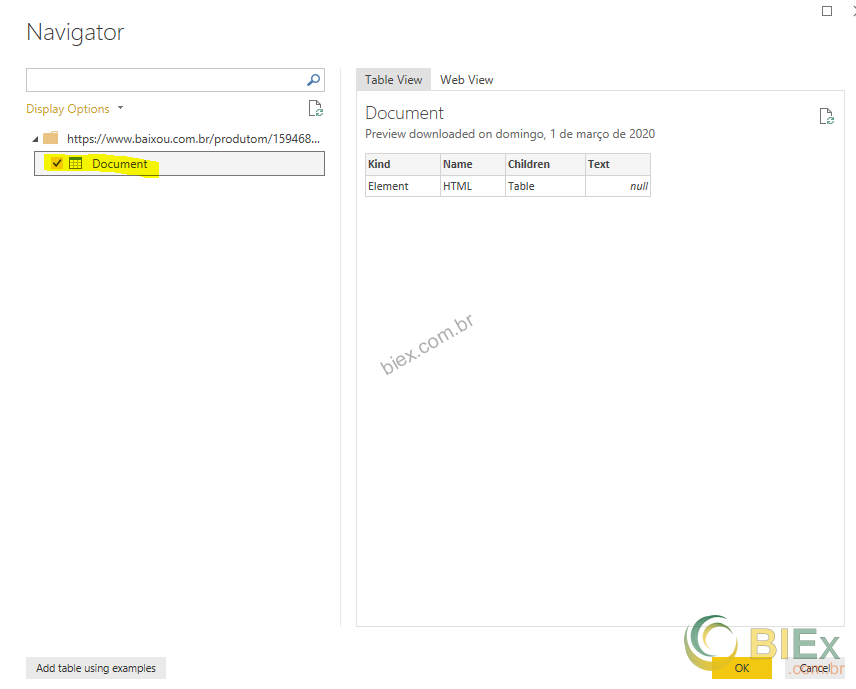
This step is necessary because this site does not have structure data in tables and all information that we want is within the graph. Let get the data of it.
How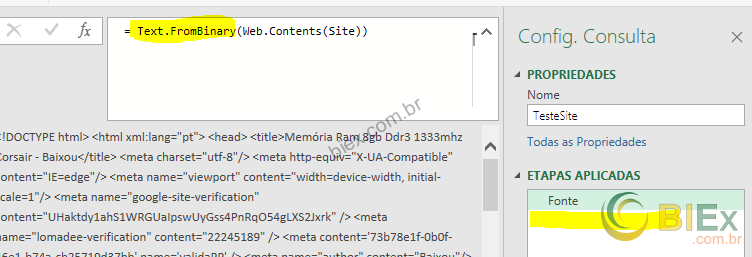
How
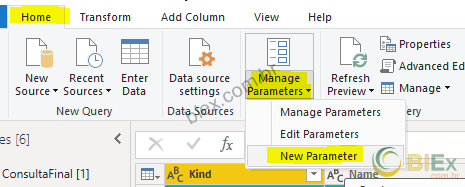
A. Home > Parameters > Manege parameter > New Parameter.
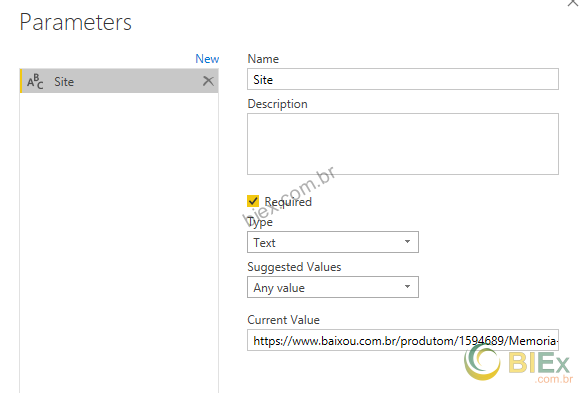
This step is similar as the step 10 in the Dolar Query.
Why
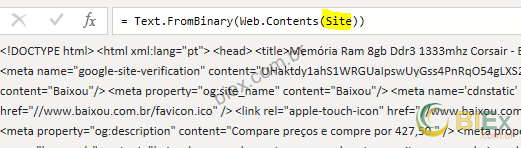
If we open the site using Google Chome and inspect its code (Ctrl+I), we will find out that in a piece of the code has the data that we want in a structure way this pattern can be converted as a table, so our goal is to split and get only this piece of the code.

B. Next Text.Split(Item A, “</script>”){0}, will break the HTML code again using the text “</script>” and we will get the 1st part of this list {0}.
C. Next Text.Replace(Item B, “‘”, “”), will remove all single quotes from the text.
D. And to finish Text.Split(Item C, ,”;”), splits the formula using semicolon.
7. Filter the rows that contains the character “[“.
How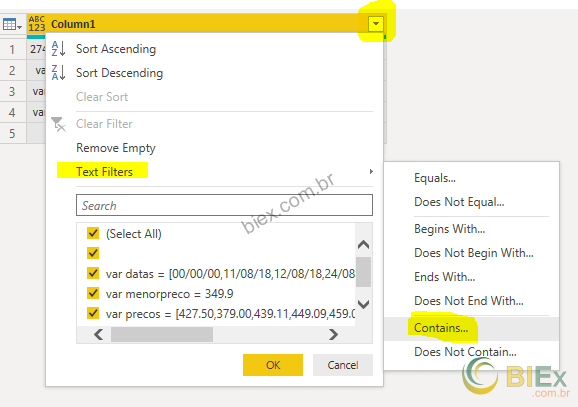
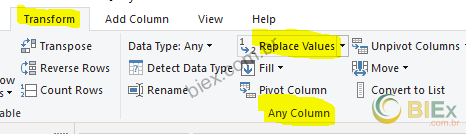
8. Replace the value “[” to nothing in the only column of the table.
How
In Transform > Any Column > Replace Values
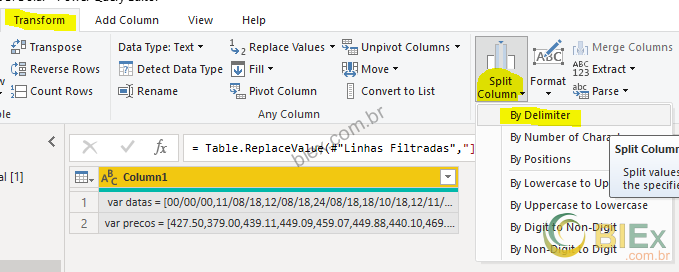
9. Split a column by delimiter using “[“.
How
In Transform > Text Column > Split Column > By Delimiter.
10. Change the Column “Column1.2” with the custom formula each Text.Split(_,”,”). Similar as the step 6 of the Query Dolar.
11. Add a custom column similar as the step 10 of the query Dolar: = Table.FromColumns(#”Prefixo Adicionado”[Column1.2])
12. Similar as the Step 7, let’s filter the Rows that is different than “00/00/00” and “” (blank).
13. Rename the column Column1 and Column2 to Data and Valor.
How
This can be done by double click the header of the table, once for each column.
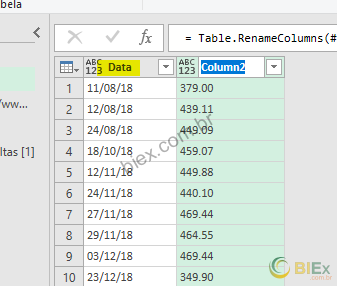
14. Replace the caracter dot by comma in the column “Valor”. Similar as the step 8. IMPORTANT: this step is necessary for users that has comma as decimal separator.
15. And detect data type, Data most be date and Valor most be number.
The code will be some thing like this:let
Fonte = Text.FromBinary(Web.Contents(Site)),
Personalizar2 = Text.Split(Text.Replace(Text.Split(Text.Split(Fonte, " var prodId = "){1}, "</script>"){0}, "'", ""),";"),
#"Convertido para Tabela1" = Table.FromList(Personalizar2, Splitter.SplitByNothing(), null, null, ExtraValues.Error),
#"Linhas Filtradas" = Table.SelectRows(#"Convertido para Tabela1", each Text.Contains([Column1], "[")),
#"Valor Substituído" = Table.ReplaceValue(#"Linhas Filtradas","]","[",Replacer.ReplaceText,{"Column1"}),
#"Dividir Coluna por Delimitador" = Table.SplitColumn(#"Valor Substituído", "Column1", Splitter.SplitTextByDelimiter("[", QuoteStyle.Csv), {"Column1.1", "Column1.2", "Column1.3"}),
#"Tipo Alterado1" = Table.TransformColumnTypes(#"Dividir Coluna por Delimitador",{{"Column1.1", type text}, {"Column1.2", type text}, {"Column1.3", type text}}),
#"Prefixo Adicionado" = Table.TransformColumns(#"Tipo Alterado1", {{"Column1.2", each Text.Split(_,","), type list}}),
#"Outras Colunas Removidas" = Table.FromColumns(#"Prefixo Adicionado"[Column1.2]),
#"Linhas Filtradas2" = Table.SelectRows(#"Outras Colunas Removidas", each ([Column1] <> "00/00/00")),
#"Colunas Renomeadas" = Table.RenameColumns(#"Linhas Filtradas2",{{"Column1", "Data"}, {"Column2", "Valor"}}),
#"Valor Substituído1" = Table.ReplaceValue(#"Colunas Renomeadas",".",",",Replacer.ReplaceText,{"Valor"}),
#"Tipo Alterado2" = Table.TransformColumnTypes(#"Valor Substituído1",{{"Data", type date}, {"Valor", type number}}),
#"Linhas Filtradas1" = Table.SelectRows(#"Tipo Alterado2", each ([Data] <> null))
in
#"Linhas Filtradas1"Table to invoke the created function
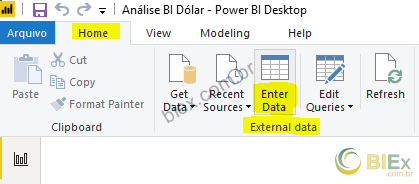
How to in Power BI
Go back to the Power BI (out of Power query), and go to Home > External Data > Enter Data
How to in Excel
Lets get out of Power Query and Back to Excel. Add a new worksheet and fill the data as shown:
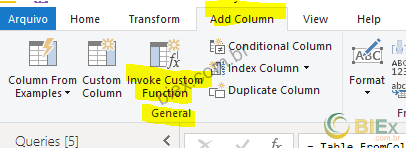
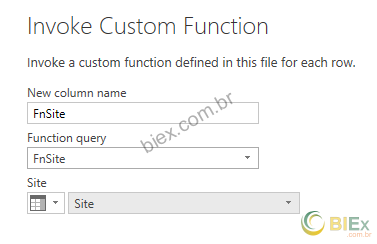
2. Add a new Column base on the Invoked Custom Function FnSite.
How
In Add Column > General > Invoke Custom Functiton.
3. Expand the add column, similar as the step 9 in query dolar.
4. Detect Data type, Data and Valor (date and number).
5. And to end this, add append the Dolar Query.
How
In Home > Combine > Append Queries.

The code will be something like this:let
Fonte = Table.FromRows(Json.Document(Binary.Decompress(Binary.FromText("nZPNboJAFIVf5Ya11xmYGYTutCRqjAkRuzIuQBolFTCAtelr9RH6Yr0D4u/GupnM7/nOnDuzWBhB4MEkydZllWfQl5yDdPhwYHT0CrXtGnU3VbUrXxg7HA7dKEy+8n13lafdqGC7Io/3VZ4yyxS2LU02ijEoYySpdYT+dl9iEGZxUn4Yy87CGMVAq3CcgrdtVYQwtGywJO0/odsjj5GlsmxLtOTjWay1kbSx0a7xHuhbm/MBBB71+mjOOdebAOEMfcaEkj3lkAkP6TTJDvCGcJVDG4AOowlhnDQZgFIcFefp02lYPeko1sagI2miGCdNEngm1FYu6lFXra6HEiqNWPmkB+GaJpfsshzNg9A51NJlzZ6+p78/RRLCLEzBIbQXFwJMIUS6+YbXvCjDpCDmrD+l9jx+wIOpXGk7LiNETgQkAhIBNQGPBGwV77yc/sWtqZOZf/4ORa/DkVduWoV7W+ivaMBtejg4+Sz0dCwy11mjH1Ih/ZWxXP4B", BinaryEncoding.Base64), Compression.Deflate)), let _t = ((type text) meta [Serialized.Text = true]) in type table [Produto = _t, Tipo = _t, Fabricante = _t, Site = _t]),
#"Tipo Alterado" = Table.TransformColumnTypes(Fonte,{{"Produto", type text}, {"Tipo", type text}, {"Fabricante", type text}, {"Site", type text}}),
#"Função Personalizada Invocada" = Table.AddColumn(#"Tipo Alterado", "FnSite", each FnSite([Site])),
#"FnSite Expandido" = Table.ExpandTableColumn(#"Função Personalizada Invocada", "FnSite", {"Data", "Valor"}, {"Data", "Valor"}),
#"Tipo Alterado1" = Table.TransformColumnTypes(#"FnSite Expandido",{{"Data", type date}, {"Valor", type number}}),
Personalizar1 = Table.Combine({#"Tipo Alterado1", Dolar})
in
Personalizar1Final Result
Média Histórica = DIVIDE(
    SUM(Dados[Valor]);
    CALCULATE(AVERAGE(Dados[Valor]);ALLEXCEPT(Dados;Dados[Produto]));0)